13 min read
Financial Highlights
Fourth Quarter 2020:
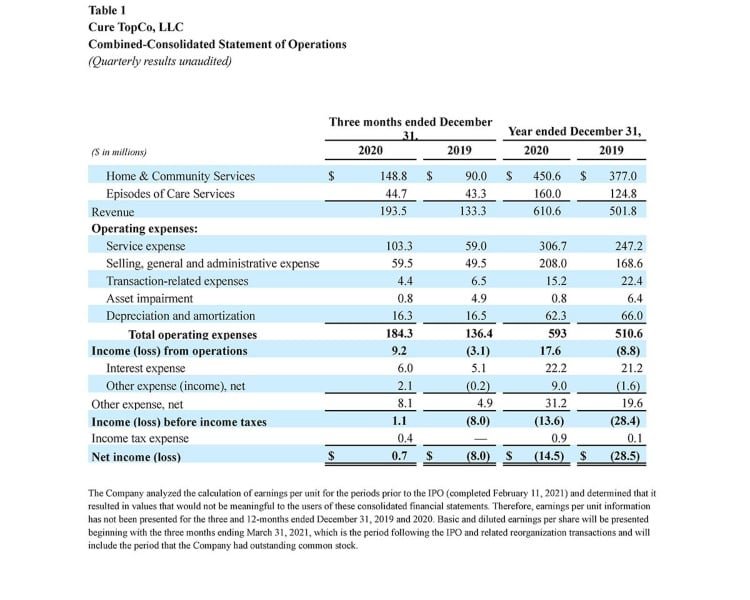
- Fourth quarter revenue of $193.5 million, an increase of 45% from 2019
- GAAP net income of $0.7 million compared to net loss of $(8.0) million in 2019
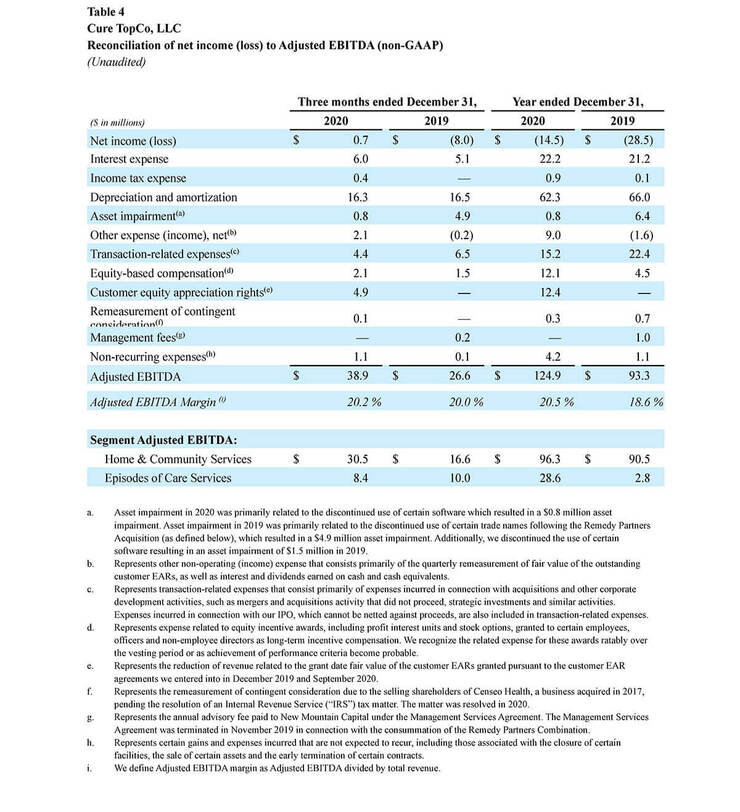
- Non-GAAP adjusted EBITDA1 of $38.9 million, an increase of 46% from 2019
Full Year 2020:
- Full-year revenue of $610.6 million, an increase of 22% from 2019
- GAAP net loss of $(14.5) million compared to net loss of $(28.5) million in 2019
- Non-GAAP adjusted EBITDA1 of $124.9 million, an increase of 34% from 2019
DALLAS and NEW YORK – March 24, 2021 – Signify Health, Inc. (NYSE: SGFY), a leading healthcare platform that leverages advanced analytics, technology and nationwide healthcare networks to create and power value-based payment programs, today announced the Company’s financial results for the fourth quarter and full year 2020.
“Signify Health delivered strong results with revenue growth of 22% in an unprecedented year, driven by our success in powering value-based payment programs at scale, as well as the dedication and hard work of our high-performing provider networks and employees," said Kyle Armbrester, Chief Executive Officer of Signify Health. "Our fourth quarter results demonstrated the ability of our networks, data and analytics scale to meet heightened customer demand. At the peak of the COVID-19 pandemic and in support of our customers and their members, our Home and Community Services (HCS) segment quickly and successfully pivoted from in-home evaluations (IHEs) to rolling out an additional virtual option. In our Episodes of Care Services (ECS) segment, we achieved significant program savings primarily through our ongoing and relentless focus on driving efficiencies among our provider partners. We also continued to drive the next phase of growth into episodic value-based arrangements with commercial plans and employers as new entrants.”
Mr. Armbrester continued, “We believe we have an attractive market opportunity with the ability to drive better patient outcomes. We plan to capture that opportunity by utilizing the proceeds from our recent initial public offering to expand our investment in value-based payment programs and our product portfolio, which will advance our mission to transform how care is paid for and delivered so that people can enjoy more healthy, happy days at home. We are greatly encouraged by the performance of our business model during the pandemic and we believe the COVID-19 vaccine will help to accelerate a return to a more normalized environment, driving our momentum into 2021.”
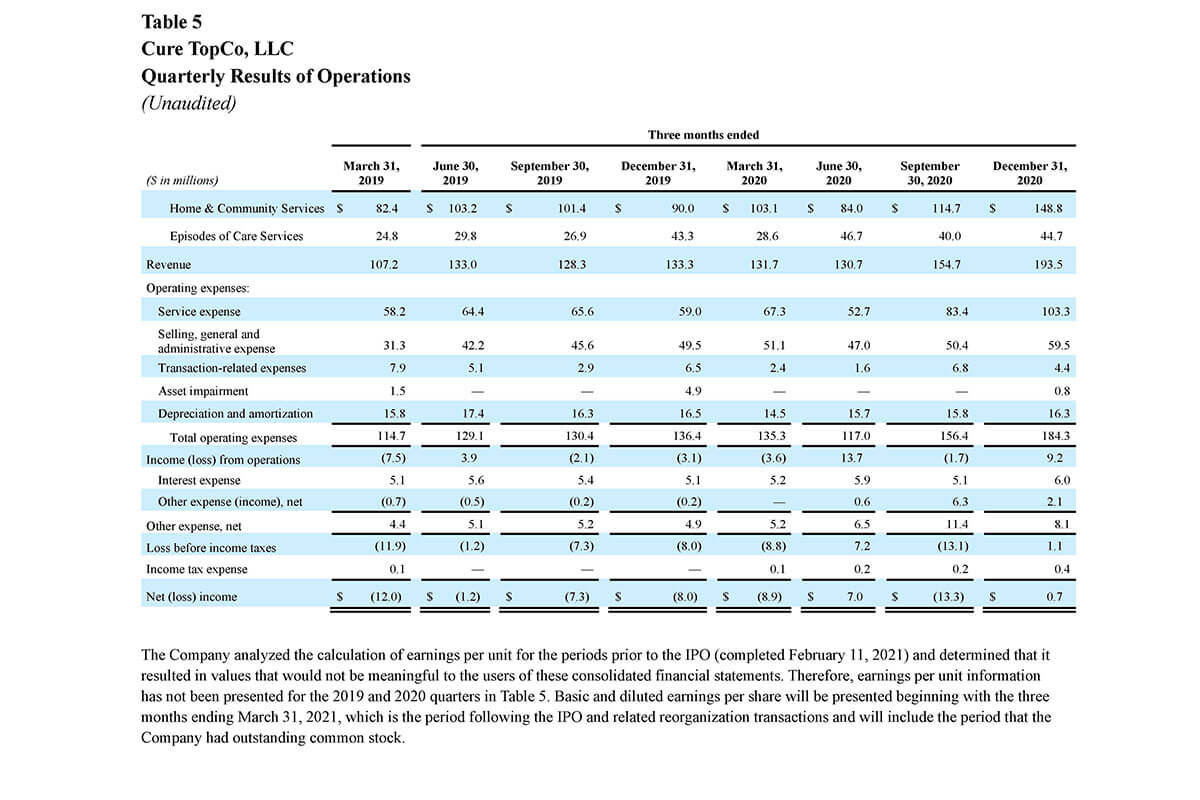
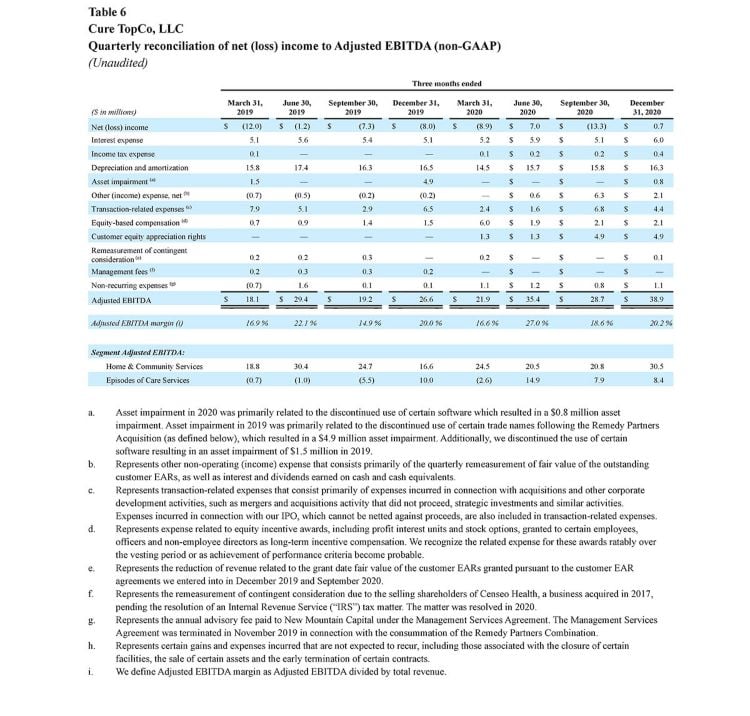
The Company presents its financial results in accordance with GAAP. However, management believes that using additional non-GAAP measures will enhance the evaluation of the profitability of the Company and its ongoing operations. Please see Tables 4 and 6 for a reconciliation of GAAP to non-GAAP financial measures. Certain columns and rows in our tables and financial statements may not sum up due to the use of rounded numbers.
Fourth Quarter 2020 Financial Results
- Total revenue for the fourth quarter increased 45% to $193.5 million, up from $133.3 million in the same period a year ago. Overall growth in the fourth quarter 2020 was driven by a 65% increase in HCS segment revenue to $148.8 million. ECS fourth quarter revenue grew 3% to $44.7 million compared to a year ago.
- The strong HCS revenue in the fourth quarter 2020 was due to an overall increase in IHE volume during the year combined with a shift in IHE volume to the latter half of the year due to the COVID-19 pandemic shutdowns in the second quarter. These factors combined to offset the usual seasonality in IHEs, which have historically been lower in the fourth quarter of each year.
- Fourth quarter 2020 ECS revenue increased primarily due to improvements in the savings rate, although the revenue impact was not as significant as in the fourth quarter of the prior year due to the earlier recognition of improvements in the savings rate based on information that became available in the third quarter of 2020 ahead of the fourth quarter reconciliation. In 2019, such information was not available and the reconciliation of actual savings to estimated savings was recorded entirely in the fourth quarter of 2019.
- Fourth quarter 2020 net income was $0.7 million compared to a net loss of $(8.0) million for the same period a year ago. The improvement was driven primarily by the total revenue growth.
- Non-GAAP Adjusted EBITDA1 for the fourth quarter 2020 increased 46% to $38.9 million, compared to $26.6 million for the fourth quarter 2019, driven primarily by revenue growth.
- Non-GAAP Adjusted EBITDA margin1 for the fourth quarter 2020 was 20.2%, a 20 basis point improvement from the comparable year ago period.
Full Year 2020 Financial Results
- Total 2020 revenue for the year increased 22% to $610.6 million, compared to $501.8 million a year ago. Overall revenue growth in the year was driven by a 20% increase in HCS revenue to $450.6 million and a 28% increase in ECS revenue to $160.0 million. Total revenue in 2020 was reduced by $12.4 million in equity appreciation rights (EARs).
- HCS revenue growth in 2020 was primarily driven by an increase in IHEs performed to 1.4 million, up from 1.1 million in 2019, partially offset by the introduction and mix of virtual IHEs performed during 2020, which have a lower price per evaluation than in-person IHEs. Increases in customer demand throughout 2020 drove IHE growth.
- ECS growth in 2020 was driven by a 200 basis point improvement in the weighted average savings rate to 7.3%, from 5.3% in 2019. The 2020 savings rate was positively impacted by improved partner performance and the exclusion of certain lower performing episodes from reconciliation as part of COVID-19 relief offered by the Center for Medicare & Medicaid Innovation (CMMI) for the BPCI-A program. Partially offsetting ECS revenue growth was a 15% decrease in weighted average program size to $5.2 billion, compared to $6.1 billion in 2019. Program size was reduced in 2020 primarily due to the effects of COVID-19, including fewer elective procedures and a general reduction in individuals seeking medical care, as well as CMMI’s COVID-19 relief, which allowed providers to exclude certain episodes.
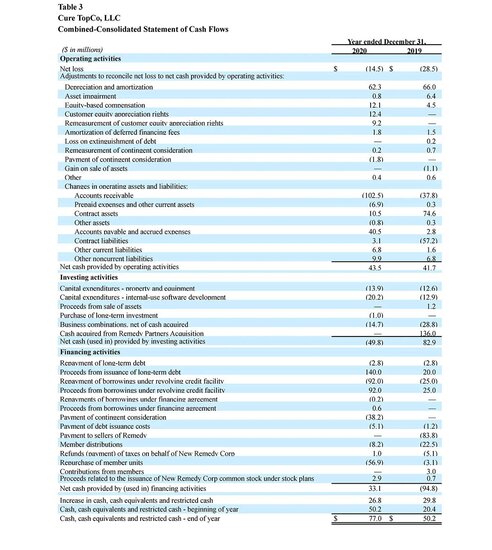
- Total net loss for 2020 improved to $(14.5) million compared to $(28.5) million in 2019. The improvement was driven by total revenue growth of 22%, partially offset by a 16% increase in total operating expenses.
- Non-GAAP Adjusted EBITDA1 for the year increased 34% to $124.9 million, compared to $93.3 million for 2019 driven by the aforementioned increases in revenue.
- Full year Non-GAAP Adjusted EBITDA margin1 was 20.5%, a 190 basis point improvement from a year ago, driven by revenue growth and efficiencies among our provider partners.
Initial Public Offering
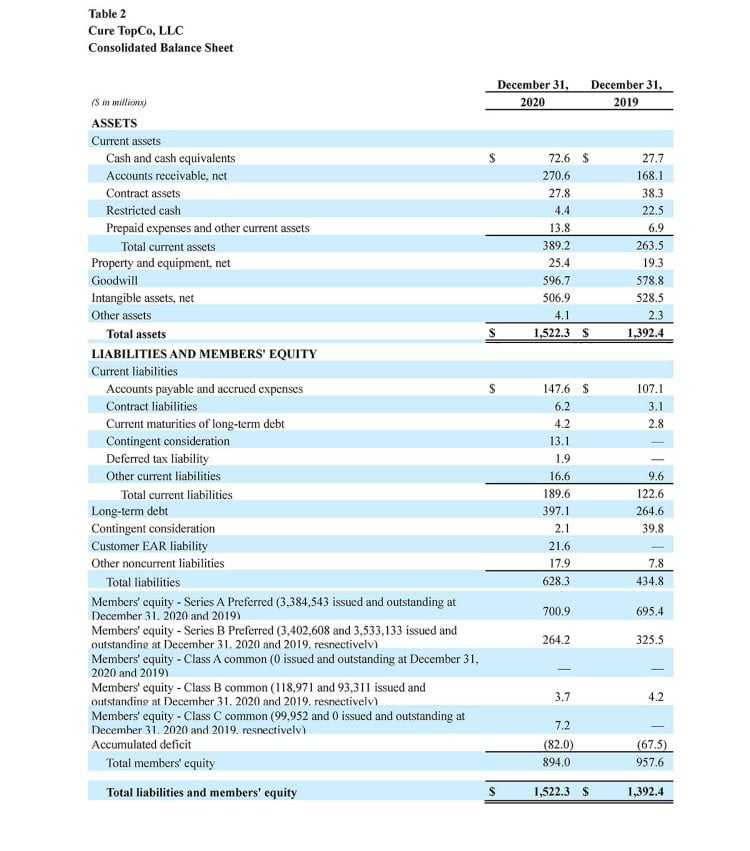
On February 11, 2021, Signify Health’s Class A common stock began trading on the New York Stock Exchange under the ticker symbol SGFY in connection with its initial public offering (IPO) of 27,025,000 shares of Class A common stock (including the full exercise of the underwriters’ over allotment of shares), at a price to the public of $24.00 per share. Signify Health received net proceeds of approximately $609.7 million after deducting underwriting discounts and commissions and before deducting offering expenses.
2021 Outlook
Signify Health estimates the following full year 2021 results with the assumption that the COVID-19 pandemic continues to improve in 2021:
- Total GAAP revenue in the range of $725 million to $760 million (reduced by approximately $19.7 million relating to the EARs); and
- Total adjusted EBITDA1 in the range of $150 million to $160 million.
Signify Health estimates the following key performance indicators for full year 2021:
- HCS segment IHEs in the range of 1.70 million to 1.75 million;
- ECS segment weighted average program size in the range of $5.1 billion to $5.3 billion; and
- ECS segment weighted average savings rate improvement of 25-50 basis points from 2020.
1Adjusted EBITDA and Adjusted EBITDA margin are non-GAAP financial measures. Refer to the reconciliation in “Non-GAAP Financial Measures.” We have not reconciled guidance for adjusted EBITDA to net income/loss, the most directly comparable GAAP measure, and have not provided forward-looking guidance for net income/loss because of the uncertainty around certain items that may impact net income/loss, including stock-based compensation, that are not within our control or cannot be reasonably predicted.
Conference Call Information
Signify Health will host a conference call to discuss the Company’s fourth quarter and full year 2020 results on March 25, 2021 at 8:30am ET. A live audio webcast of the conference call may be accessed through the investor relations section of Signify Health’s website at investors.signifyhealth.com/events/default.aspx and will be available for replay through May 25, 2021.
About Signify Health
Signify Health is a leading healthcare platform that leverages advanced analytics, technology, and nationwide healthcare provider networks to create and power value-based payment programs. Our mission is to transform how care is paid for and delivered so that people can enjoy more healthy, happy days at home. Our solutions support value-based payment programs by aligning financial incentives around outcomes, providing tools to health plans and healthcare organizations designed to assess and manage risk and identify actionable opportunities for improved patient outcomes, coordination and cost-savings. Through our platform, we coordinate what we believe is a holistic suite of clinical, social, and behavioral services to address an individual’s healthcare needs and prevent adverse events that drive excess cost, all while shifting services towards the home.
Forward Looking Statements
This press release contains forward-looking statements. All statements other than statements of historical fact included in this press release are forward-looking statements. These statements may be preceded by, followed by or include the words “may,” “might,” “will,” “should,” “expects,” “plans,” “anticipates,” “believes,” “estimates,” “predicts,” “potential” or “continue,” the negative of these terms and other comparable terminology. These forward-looking statements, which are subject to risks, uncertainties and assumptions about us, may include projections of our future financial performance, our anticipated growth strategies and anticipated trends in our business, our plan to drive better patient outcomes, our 2021 Outlook, including our 2021 estimates for total GAAP revenue, total Adjusted EBITDA, in-home evaluations, program size and weighted average savings rate improvements, and our plan to utilize the proceeds from our IPO to expand our investment in value-based payment programs and in our product portfolio. These statements are only predictions based on our current expectations and projections about future events. There are important factors that could cause our actual results, level of activity, performance or achievements to differ materially from the results, level of activity, performance or achievements expressed or implied by the forward-looking statements.
Although we believe the expectations reflected in the forward-looking statements are reasonable, we cannot guarantee future results, level of activity, performance or achievements. Moreover, neither we nor any other person assumes responsibility for the accuracy and completeness of any of these forward-looking statements. Some of the factors that could cause actual results to differ materially from those expressed or implied by the forward-looking statements include: the COVID-19 pandemic and whether the pandemic will continue to subside in 2021; our dependence upon a limited number of key customers; our dependence on certain key government programs; our failure to maintain and grow our network of high-quality providers; our failure to continue to innovate and provide services that are useful to customers and achieve and maintain market acceptance; our limited operating history with certain of our solutions; our failure to compete effectively; the length and unpredictability of our sales cycle; failure of our existing customers to continue or renew their contracts with us; failure of service providers to meet its obligations to us; seasonality that may cause fluctuations in our sales, cash flows and results of operations; our failure to achieve or maintain profitability; our revenue not growing at the rates they historically have, or at all; our failure to successfully execute on our growth initiatives, business strategies, or operating plans, including growth in our Commercial Episodes business; our failure to successfully launch new products; our failure to diversify sources of revenues and earnings; inaccurate estimates and assumptions used to determine the size of our total addressable market; changes in accounting principles applicable to us; incorrect estimates or judgments relating to our critical accounting policies; increases in our level of indebtedness; our failure to effectively adapt to changes in the healthcare industry, including changes in the rules governing Medicare or other federal healthcare programs; our failure to adhere to complex and evolving governmental laws and regulations; our failure to comply with current and future federal and state privacy, security and data protection laws, regulations or standards; our employment of and contractual relationships with our providers subjecting us to licensing or other regulatory risks, including recharacterization of our contracted providers as employees; adverse findings from inspections, reviews, audits and investigations from health plans; inadequate investment in or maintenance of our operating platform and other information technology and business systems; our ability to develop and/or enhance information technology systems and platforms to meet our changing customer needs; higher than expected investments in our business including, but not limited to, investments in our technology and operating platform, which could reduce our profitability; security breaches or incidents, loss or misuse of data, a failure in or breach of our operational or security systems or other disruptions; disruptions in our disaster recovery systems or management continuity planning; our ability to comply with, and changes to, laws, regulations and standards relating to privacy or data protection; our ability to obtain, maintain, protect and enforce our intellectual property; our dependence on distributions from Cure TopCo, LLC to fund dividend payments, if any, and to pay our taxes and expenses, including payments under the Tax Receivable Agreement; the control certain equity holders that held an ownership interest in Cure TopCo, LLC prior to our IPO have over us and our status as a controlled company; our ability to realize any benefit from our organizational structure; and the other risk factors described under “Risk Factors” in our filings with the Securities and Exchange Commission (“SEC”), including our Annual Report on Form 10-K for the fiscal year ended December 31, 2020, which are available free of charge on the SEC's website at: www.sec.gov.
All forward-looking statements attributable to us or persons acting on our behalf are expressly qualified in their entirety by the foregoing cautionary statements. In addition, all forward-looking statements speak only as of the date of this press release. We undertake no obligations to update or revise publicly any forward-looking statements, whether as a result of new information, future events or otherwise other than as required under the federal securities laws.
About Non-GAAP Financial Measures
This press release contains certain financial measures not presented in accordance with generally accepted accounting principles in the United State (“GAAP”), including Adjusted EBITDA and Adjusted EBITDA margin, which are used by management in making operating decisions, allocating financial resources, and internal planning and forecasting and for business strategy purposes. Adjusted EBITDA and Adjusted EBITDA margin not measures of financial performance in accordance with GAAP and may exclude items that are significant in understanding and assessing our financial results. Therefore, these measures should not be considered in isolation or as an alternative to GAAP measures. Our presentation of Adjusted EBITDA and Adjusted EBITDA margin may not be comparable to similarly-titled measures used by other companies. Management believes that such measures are commonly reported by issuers and widely used by investors as indicators of a company’s operating performance. Please refer to the reconciliations of Adjusted EBITDA and Adjusted EBITDA margin to the most directly comparable financial measures prepared in accordance with GAAP below.